When building a web API or web application it is critically important to know that the application is functioning as intended. Whether that be from a performance perspective or simply knowing that external clients are using the application correctly. Historically, for an on-premise solution that involves installing agent monitoring software and configuring a logging solution with associated storage management. With Azure, that now becomes a turn-key solution using Application Insights. Application Insights can be used whether your actual application is deployed on-premise or in the cloud. In this post, I’d like to talk about configuring Application Insights for an ASP.NET Core application and I’d also like to talk about structured logging.
Enable Application Insights for ASP.NET Core
The way to enable Application Insights for your ASP.NET Core application is to install the Nuget package into your .csproj, file as shown below.
The rest of this article assumes you are using version 2.7.1 or later of the Nuget package. There have been several changes in the last 6 months to the library.
Please add the following code to your Startup.cs,
Allocate your Application Insights resource in Azure, whichever way you prefer. This could be Azure Portal, Azure CLI, etc. See Azure Docs for more details.
In your appsettings.json, add the following:
By now you’ve enabled Application Insights for your ASP.Net Core application. You’ll now get the following features:
- Request Lodging
- Automatic dependency logging for SQL requests and HTTP requests
- A 90-day long retention period
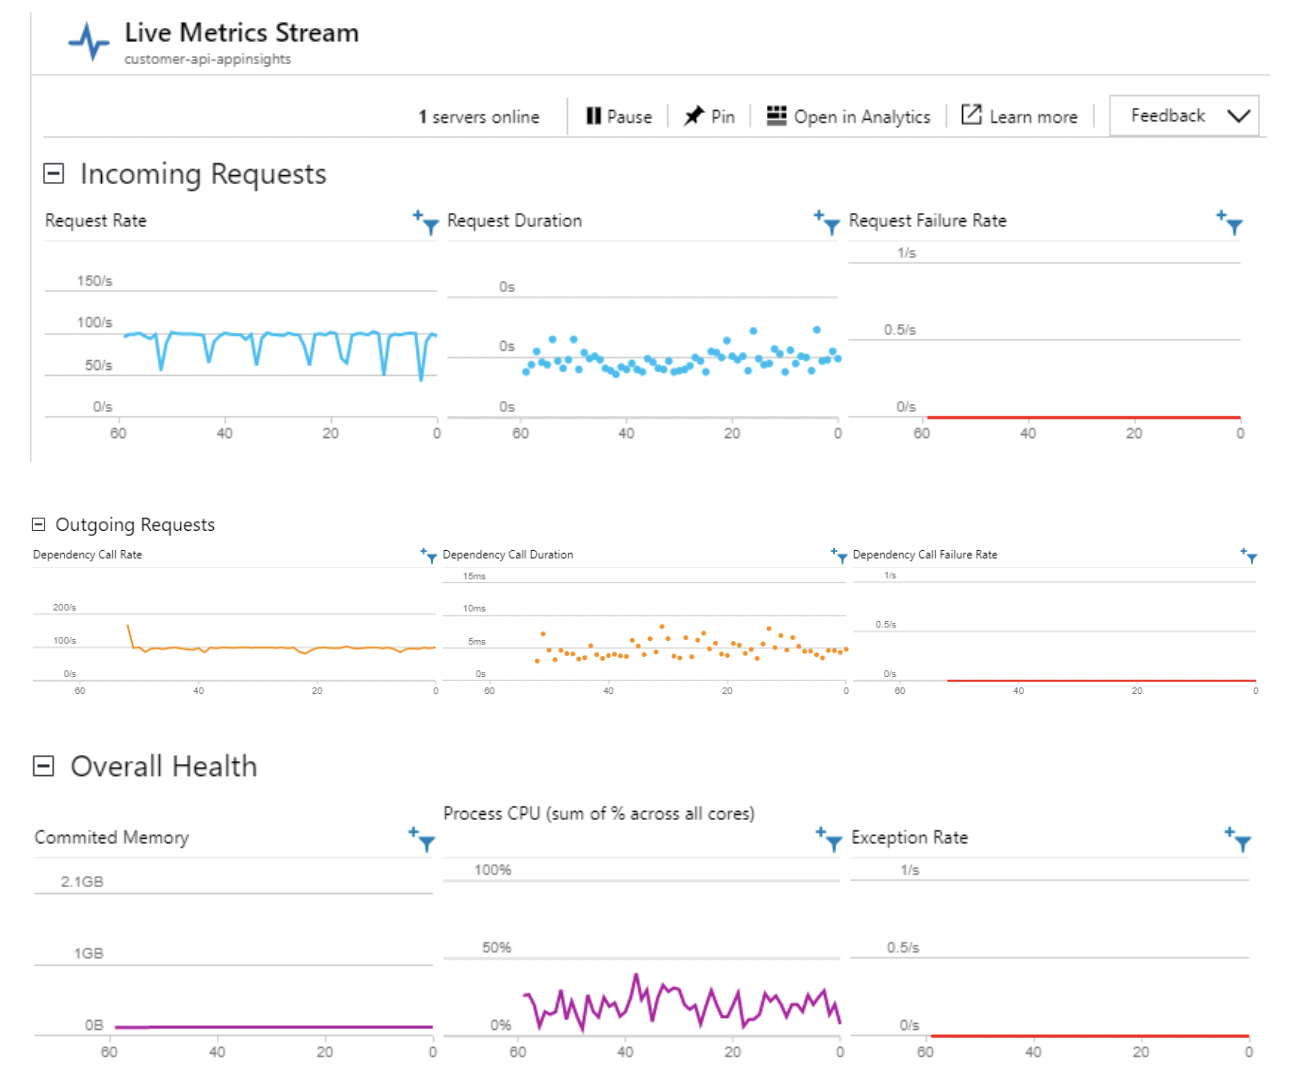
- Live metrics, which permit you to view and filter the above telemetry along while viewing CPU and memory usage statistics live. For example, see the below screenshots.
Telemetry Types and Waterfall View
One of the interesting features that Application Insights provides compared to other logging systems is that it has different kinds of telemetry. This includes RequestTelemetry, DependencyTelemetry, ExceptionTelemetry, and TraceTelemetry. Application Insights also provides the ability to have a parent operation that other telemetry operations belong to and you can view a waterfall view of a given request. For an example see the screenshot below:
Structured Logging
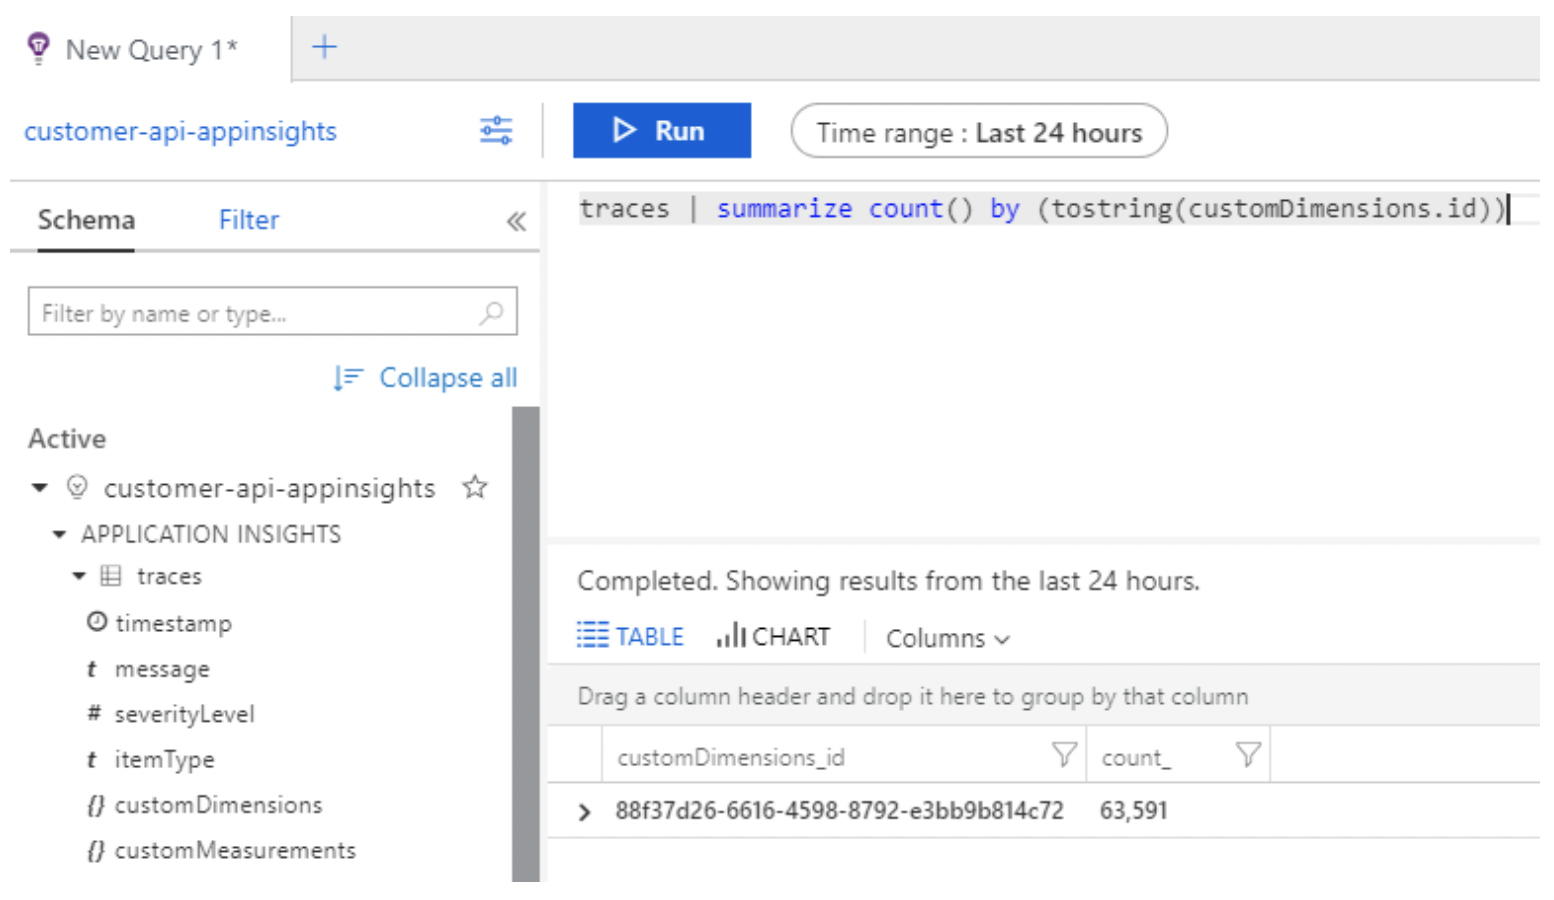
Any of the telemetry types will provide the ability to add arbitrary key-value pairs. Those values will then be logged as key-value pairs to Application Insights. Then using the Log Analytics feature of Application Insights, one can then query on those custom key-value pairs. Effectively, you are getting a schema-less ability to attach custom properties to any telemetry in real-time. This is commonly referred to as Structured Logging with other frameworks. This is so you are not creating one long message string, then trying to parse the message string. Instead, you get custom key-value pairs and can simply query for a given key having a given value. The screenshot below provides an example of a Log analytics query on a custom property:
Log Your Own Custom Messages and Telemetry
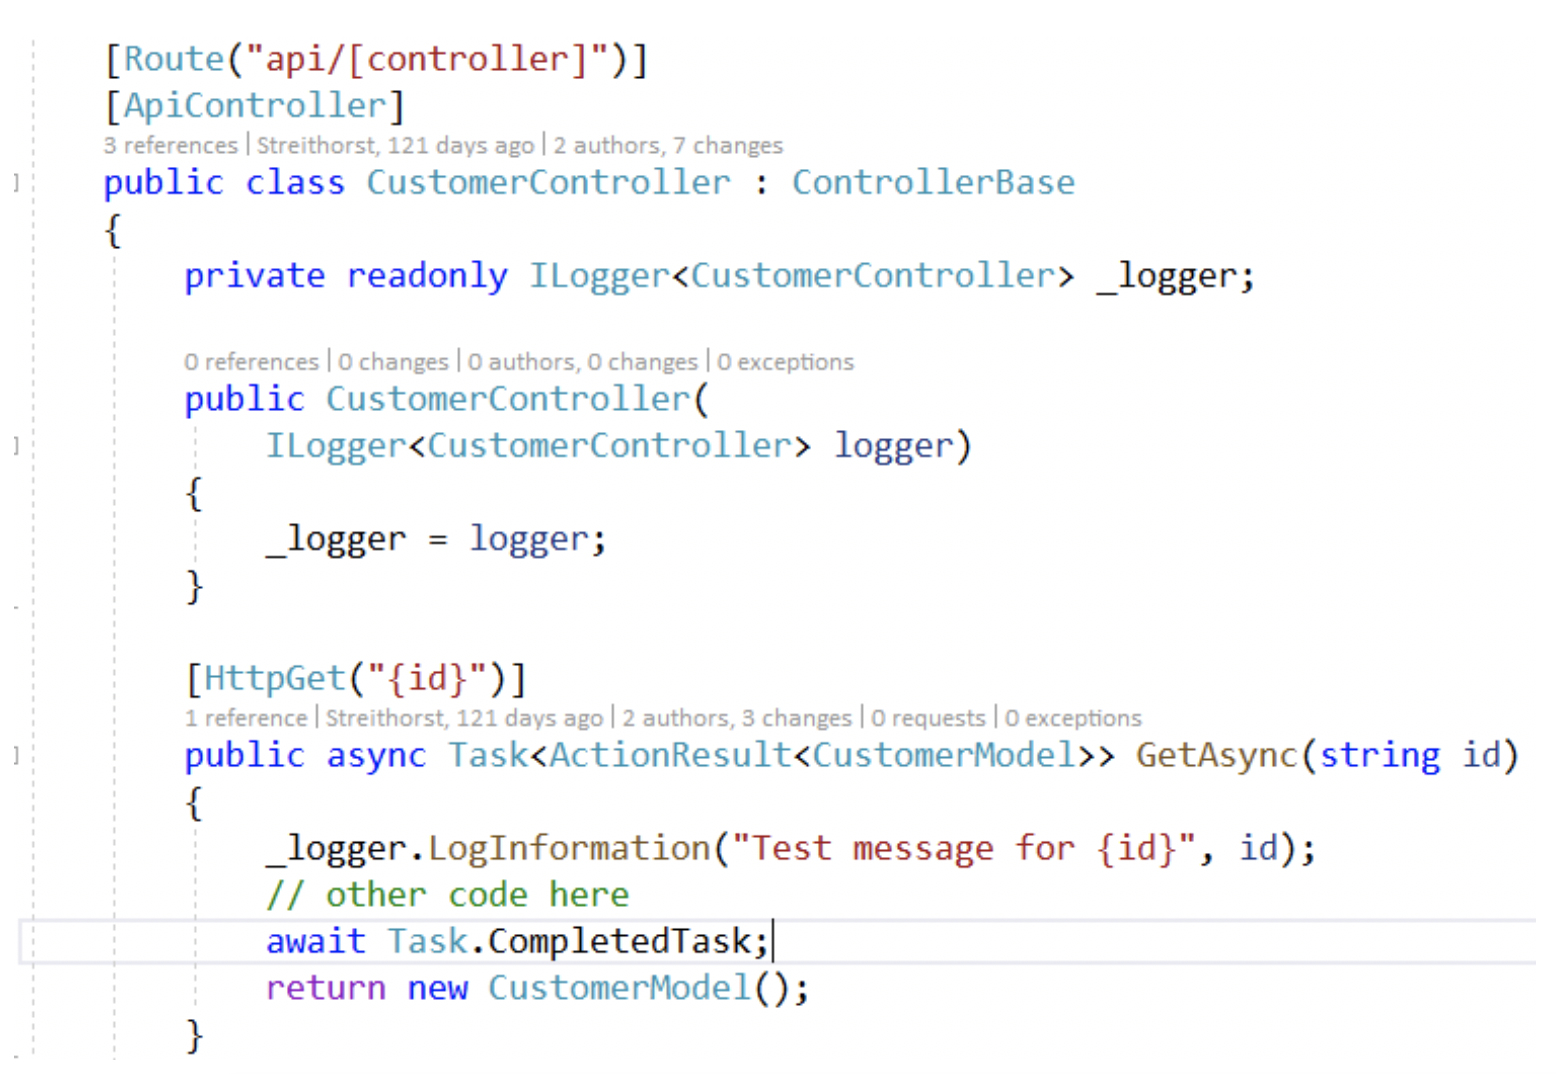
We now ask the question of how do you go about logging custom telemetry to Application Insights from within your ASP.NET Core application? The Application Insights NuGet package automatically registers the TelemetryClient class provided by the library into the Dependency Injection container. You could add that as a constructor argument to your Controller for instance and then directly call methods on the TelemetryClient. However, at this point, you are coupling more parts of your application to ApplicationInsights. It’s not necessary that you do that. With the latest versions of the ApplicationInsights NuGet for ASP.NET Core, they register an ILogger implementation with ASP.NET Core. So, you could then update your controller as follows:
In the above example, we have logged a message and a custom key-value pair. The key will be “id” and the value will be the value of the argument passed into the Get function. Notice, we have done this only with a dependency on ILogger, which is a generic abstraction provided by Microsoft. ILogger will typically log to multiple outputs, Console, ApplicationInsights and you can find many implementations of ILogger. ILogger natively supports structured logging and will pass the information down to the actual log implementation. The below example being Application Insights.
Currently, by default Application Insights will only log warning messages from ILogger. So, my above example would not work. To disable the built-in filter, you would need to add the following to Startup.cs in ConfigureServices.
Summary
With Application Insights, we can provide within minutes in Azure. You’ll receive 5 GB of data ingestion free per month and free data retention for 90 days. It is trivial to instrument your application. Some of the benefits you’ll receive are:
- Automatic logging of requests/responses
- Ability to drill into recent failures/exceptions in Azure portal
- Waterfall mapping of a request
- Automatic dependency logging of out-bound SQL and HTTP requests
- Arbitrarily query your data using Log Analytics
- Ability to drill into recent performance metrics in Azure portal
- Live metrics view as your application is running in production with filtering.
- Custom graphs and charts with Notebooks
- Ability to create an Azure Portal Dashboard
- Application map that will show the topology of your application with any external resources it uses.
Application Insights is a very powerful tool to ensure your application is functioning as intended, and it is very easy to get started. You spend your time instrumenting your application and checking application health, not time provisioning log storage solutions and picking log query tools.
Look for future blog posts covering additional topics like keeping Personally Identifiable Information (PII) out of your logs and troubleshooting your Application Insights configuration.


